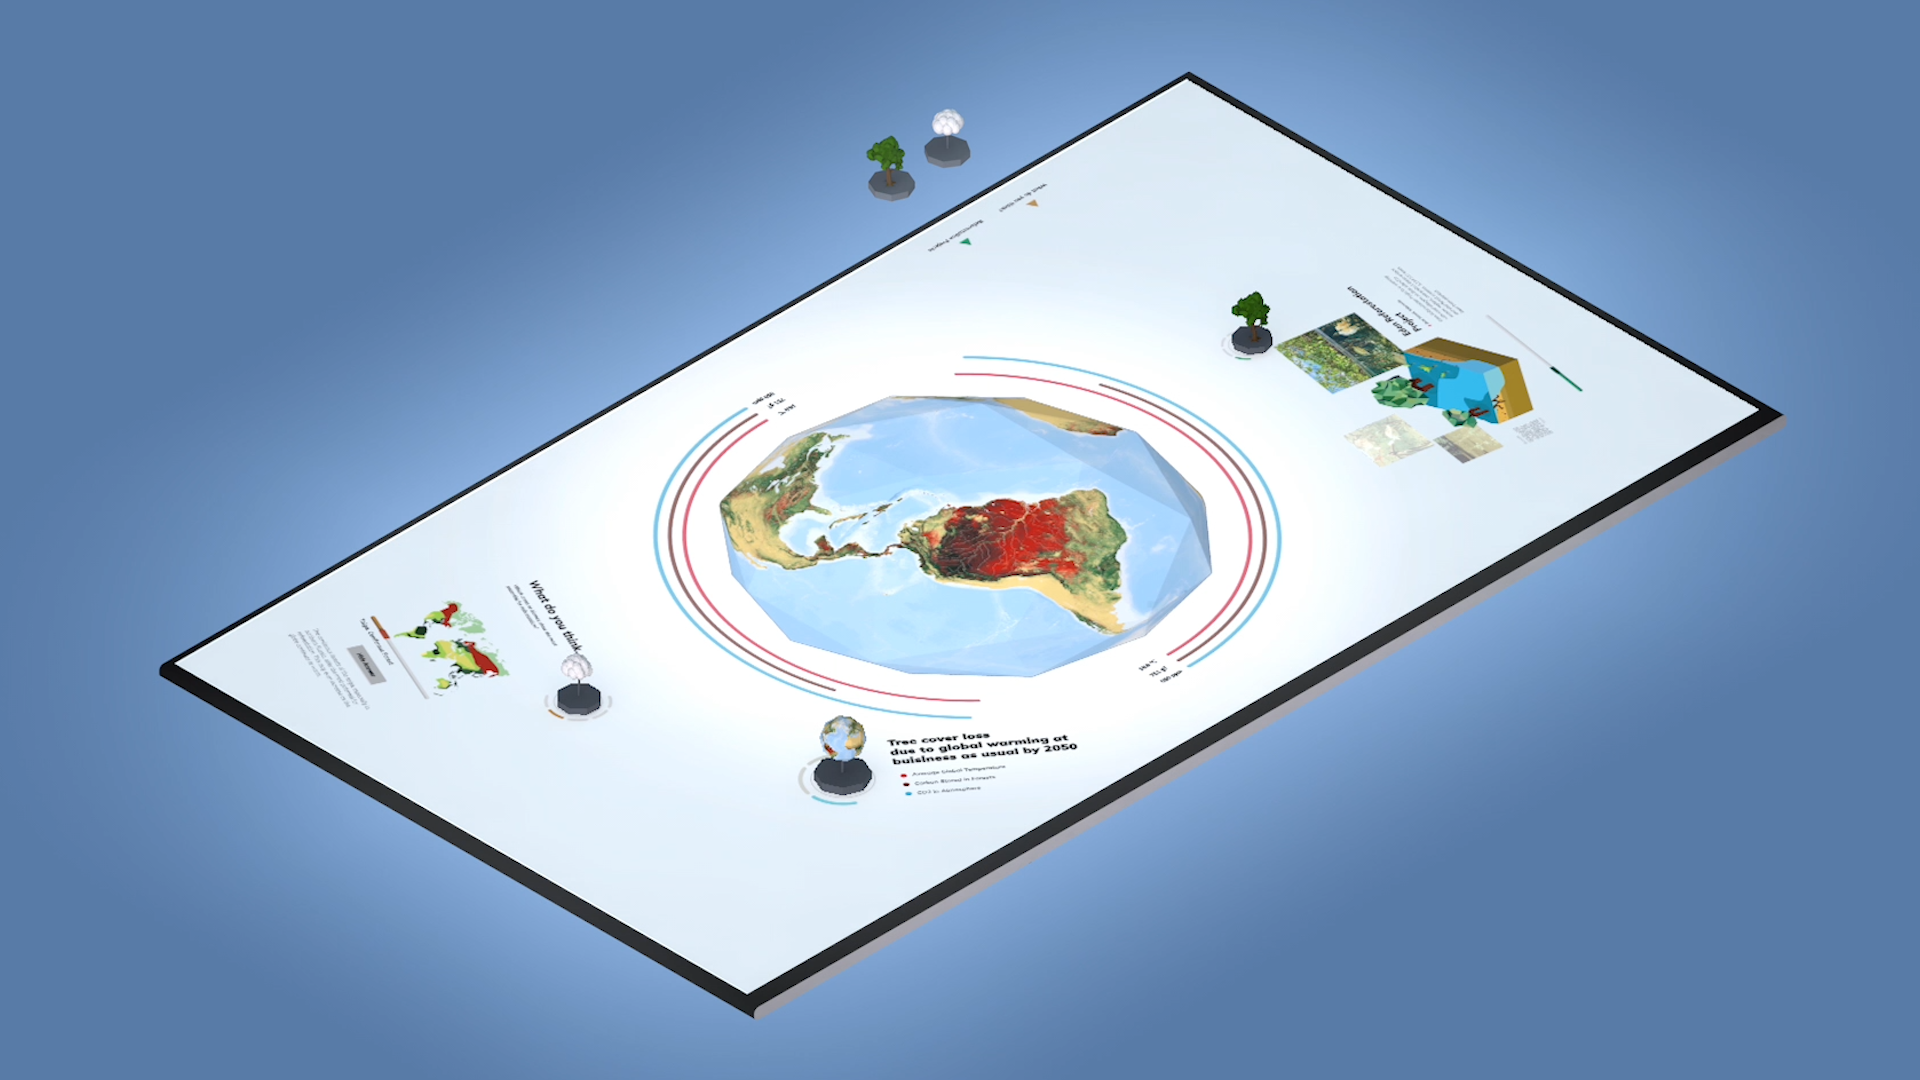
| The Goal
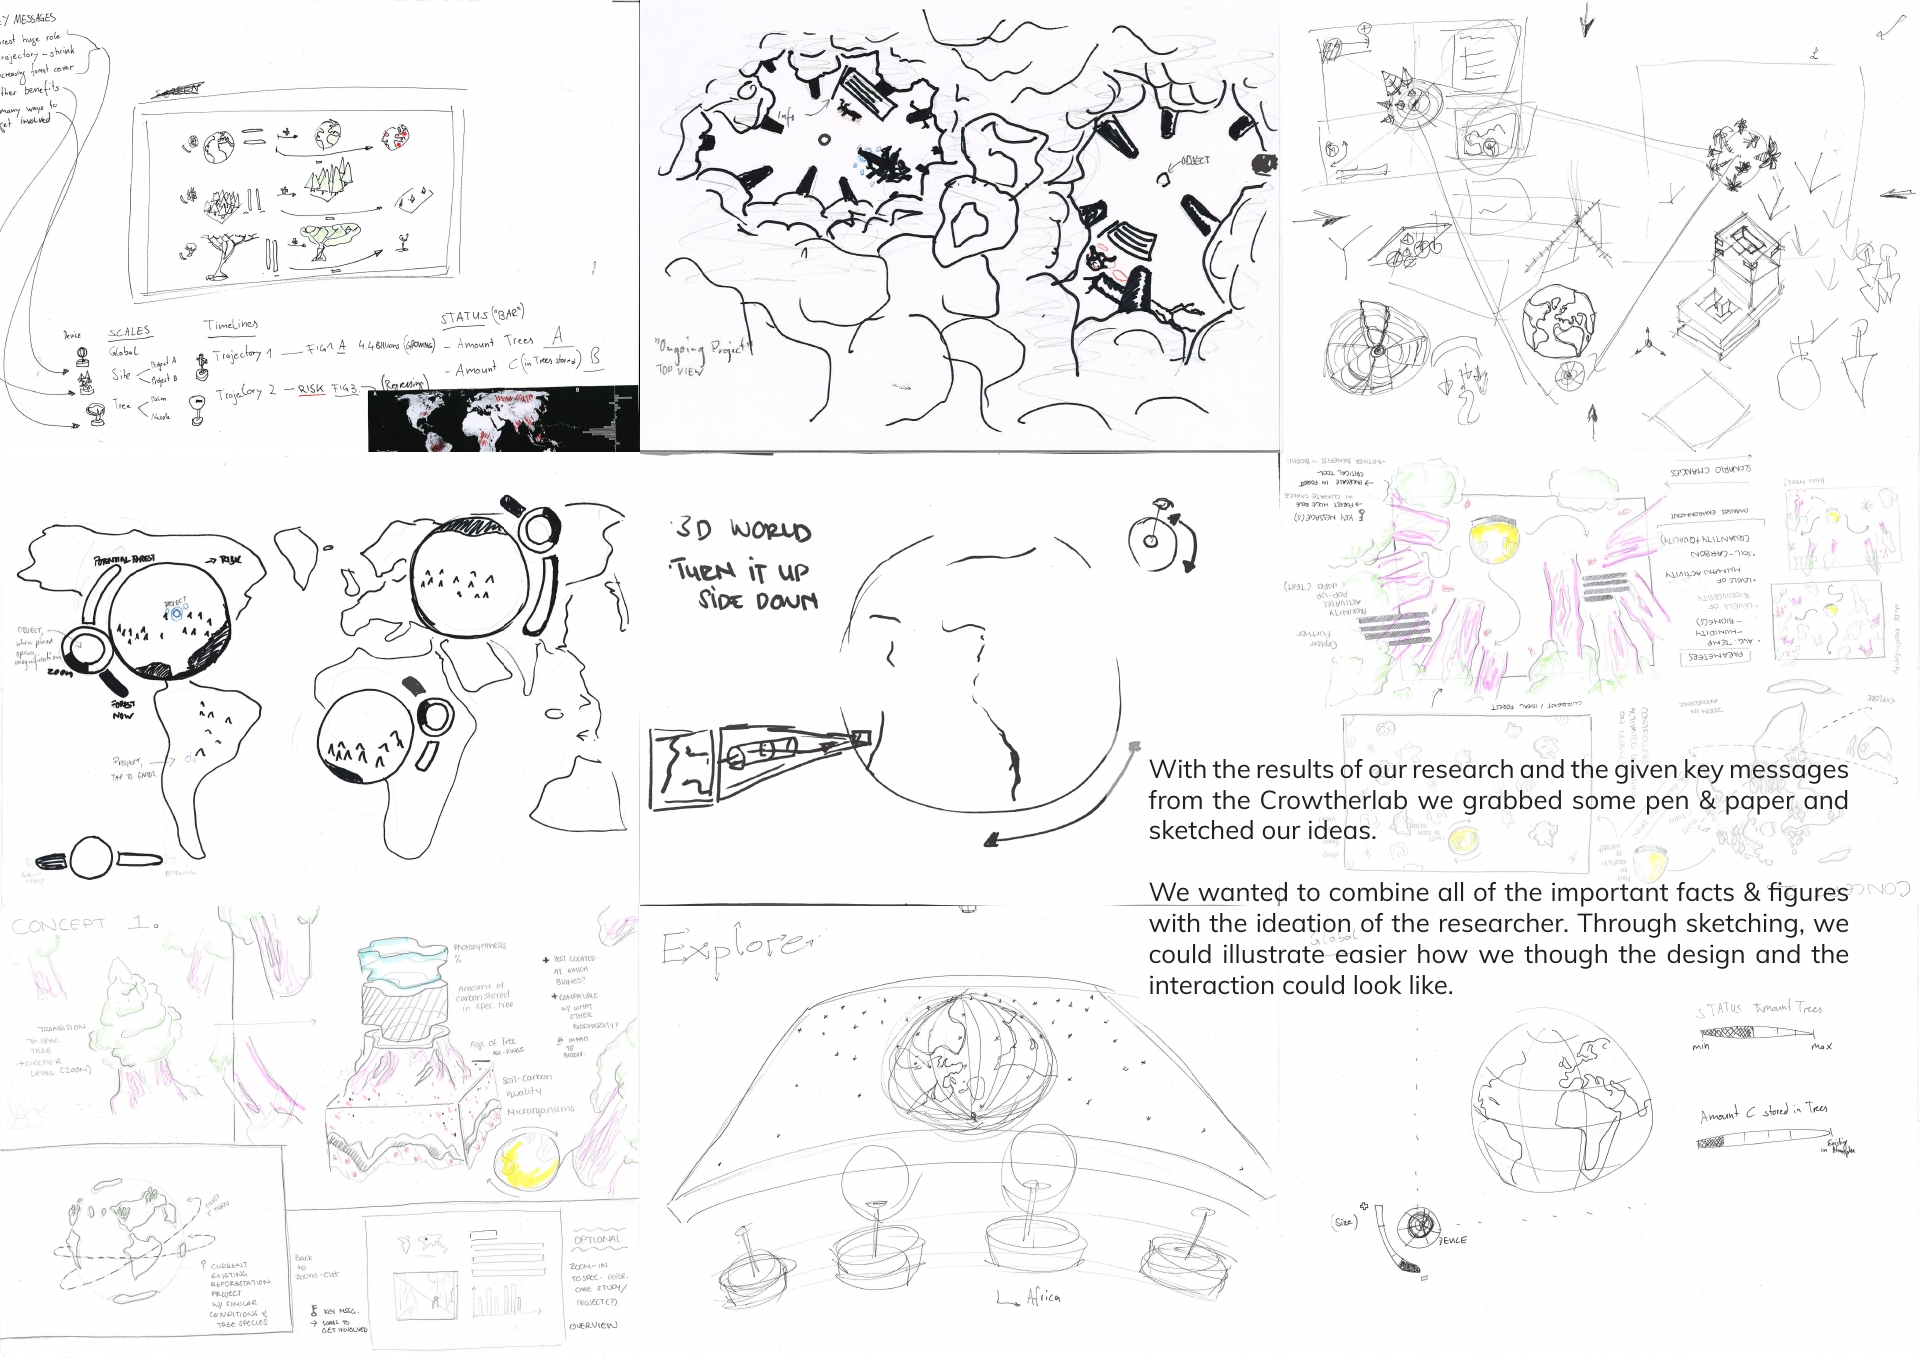
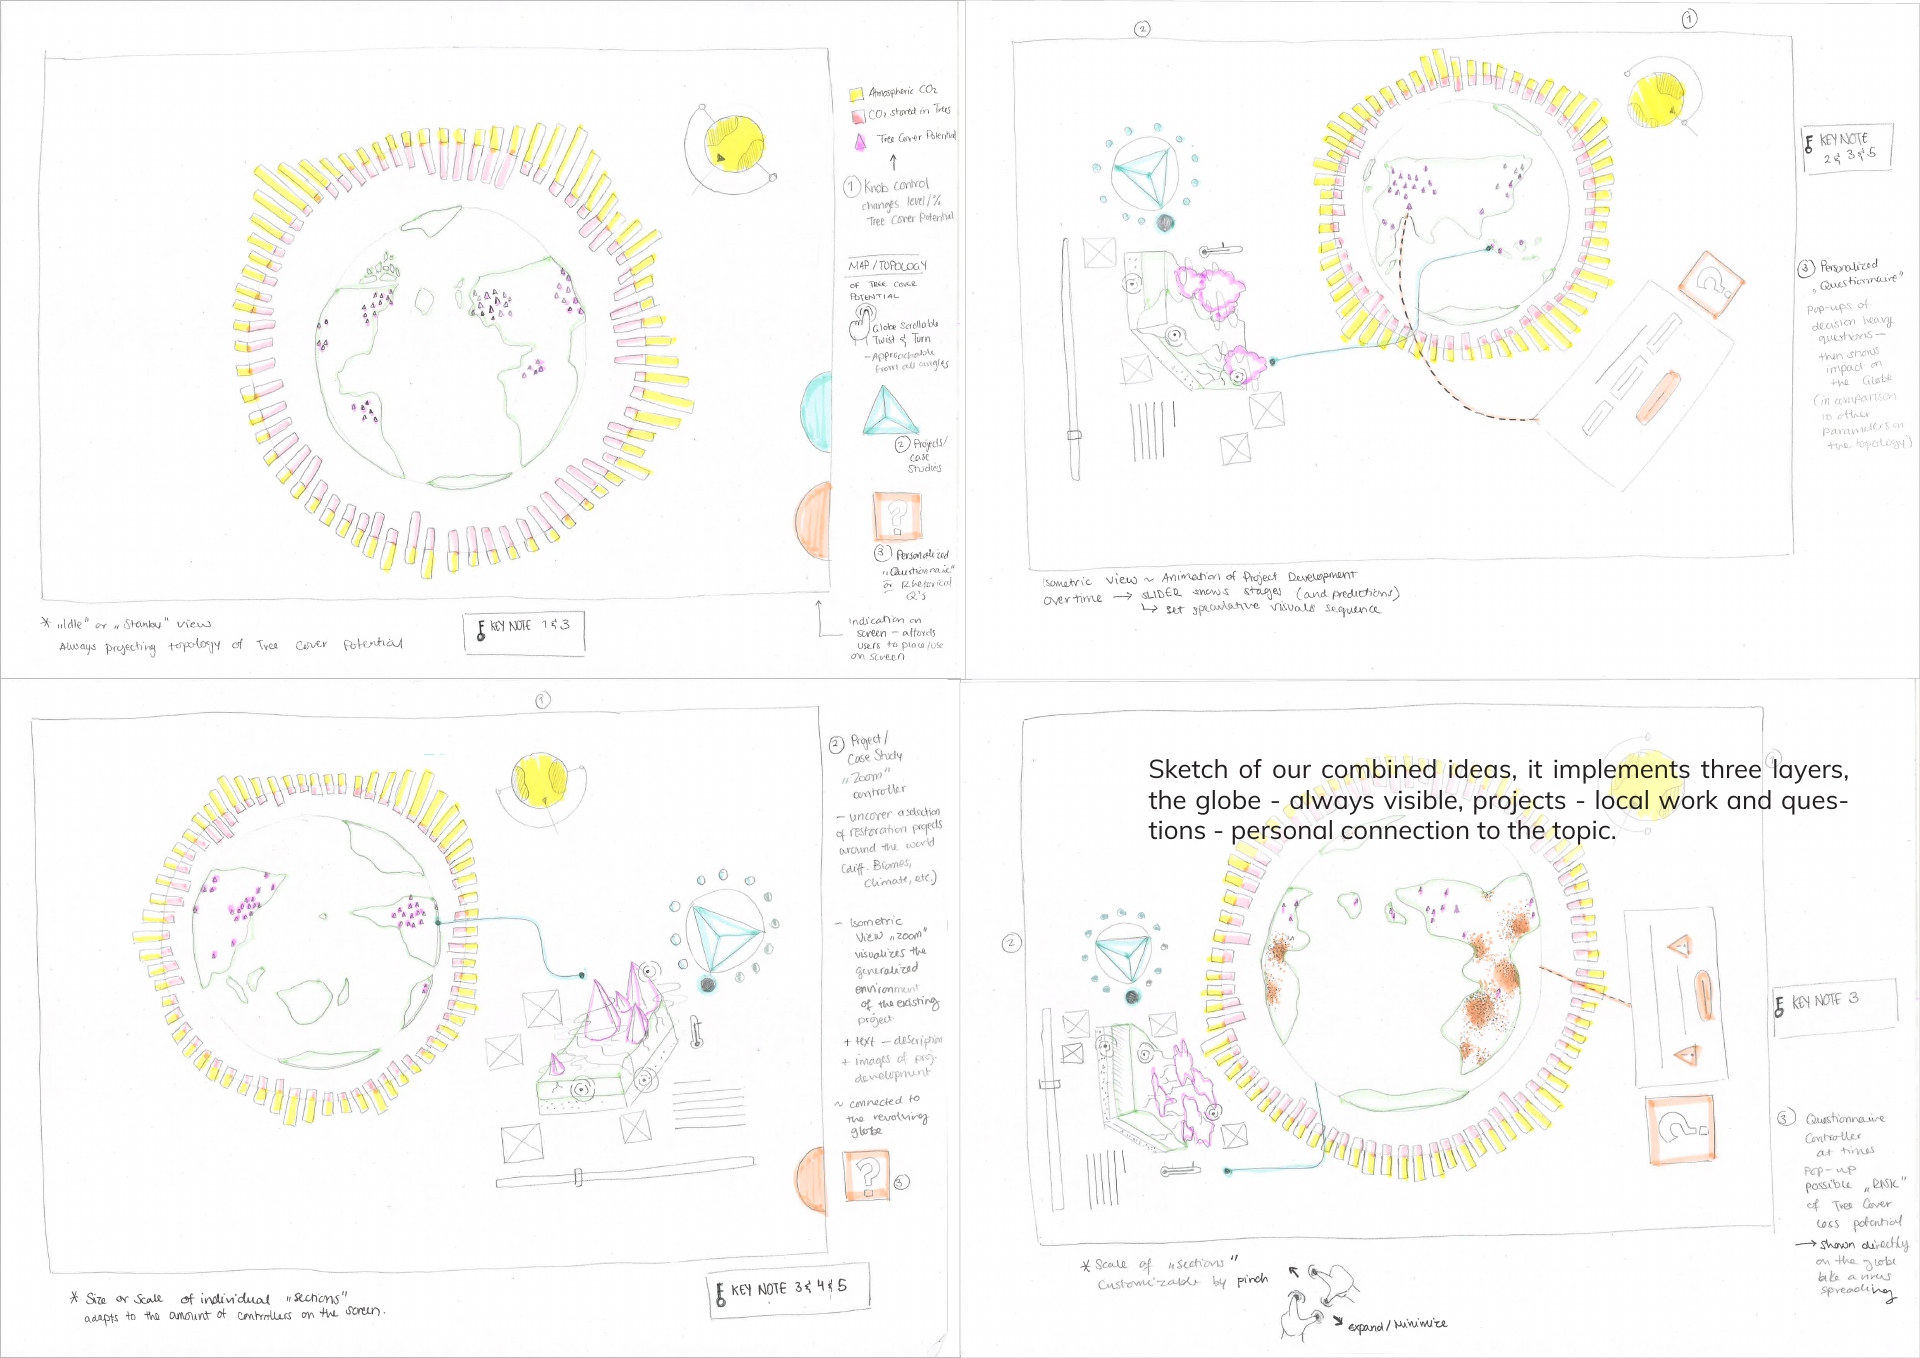
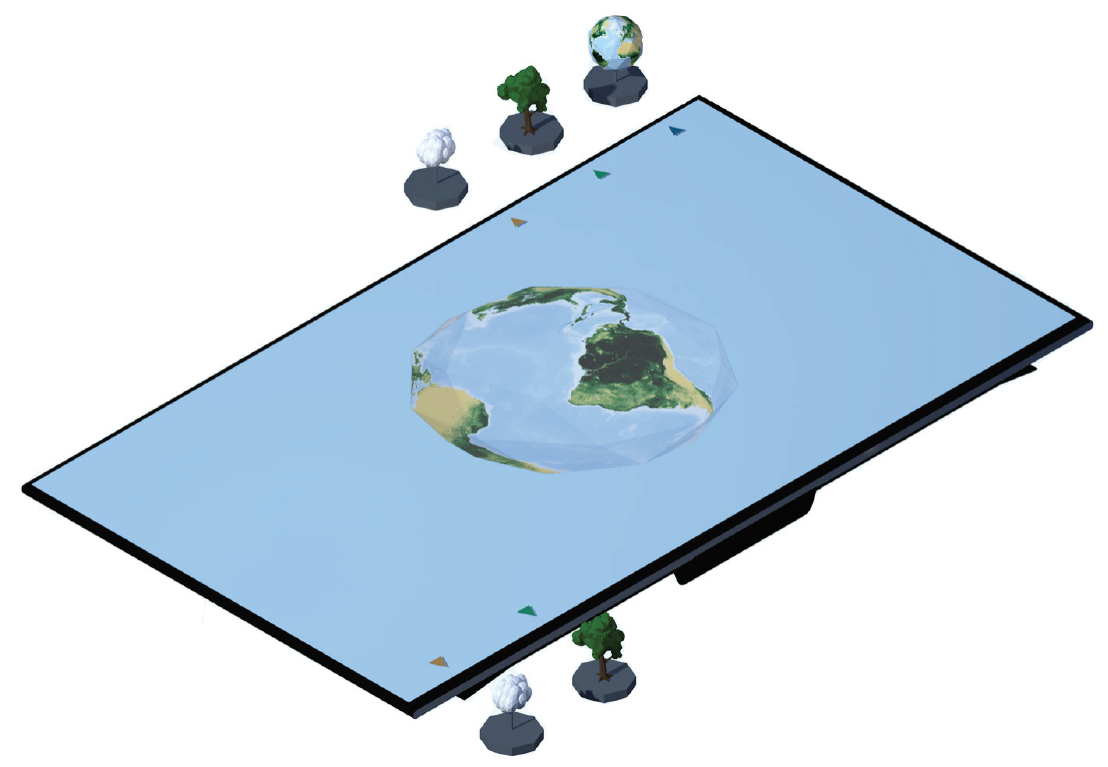
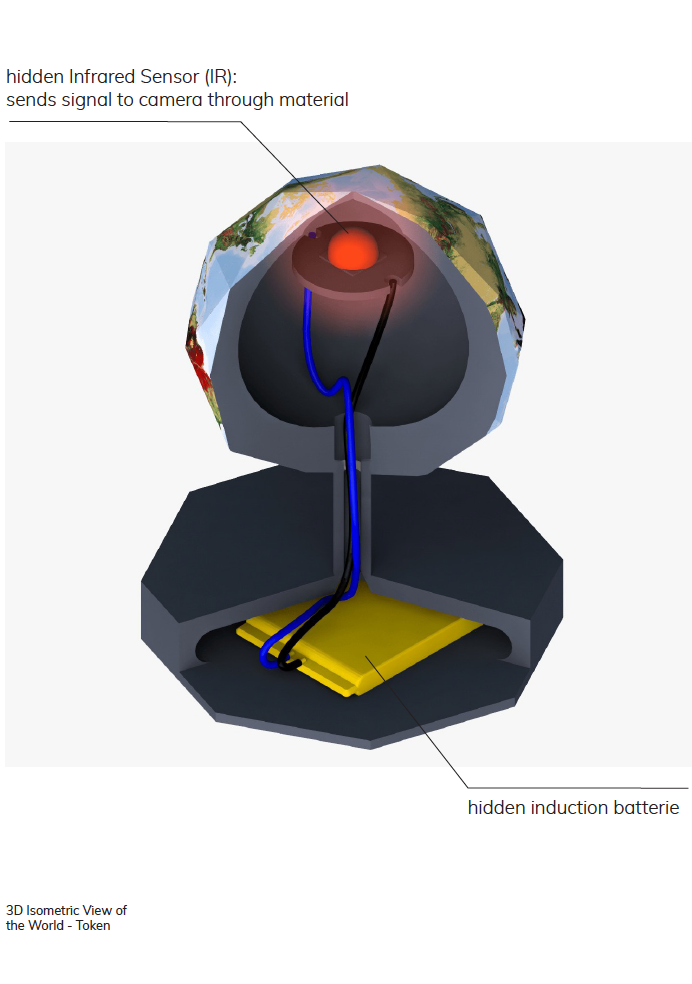
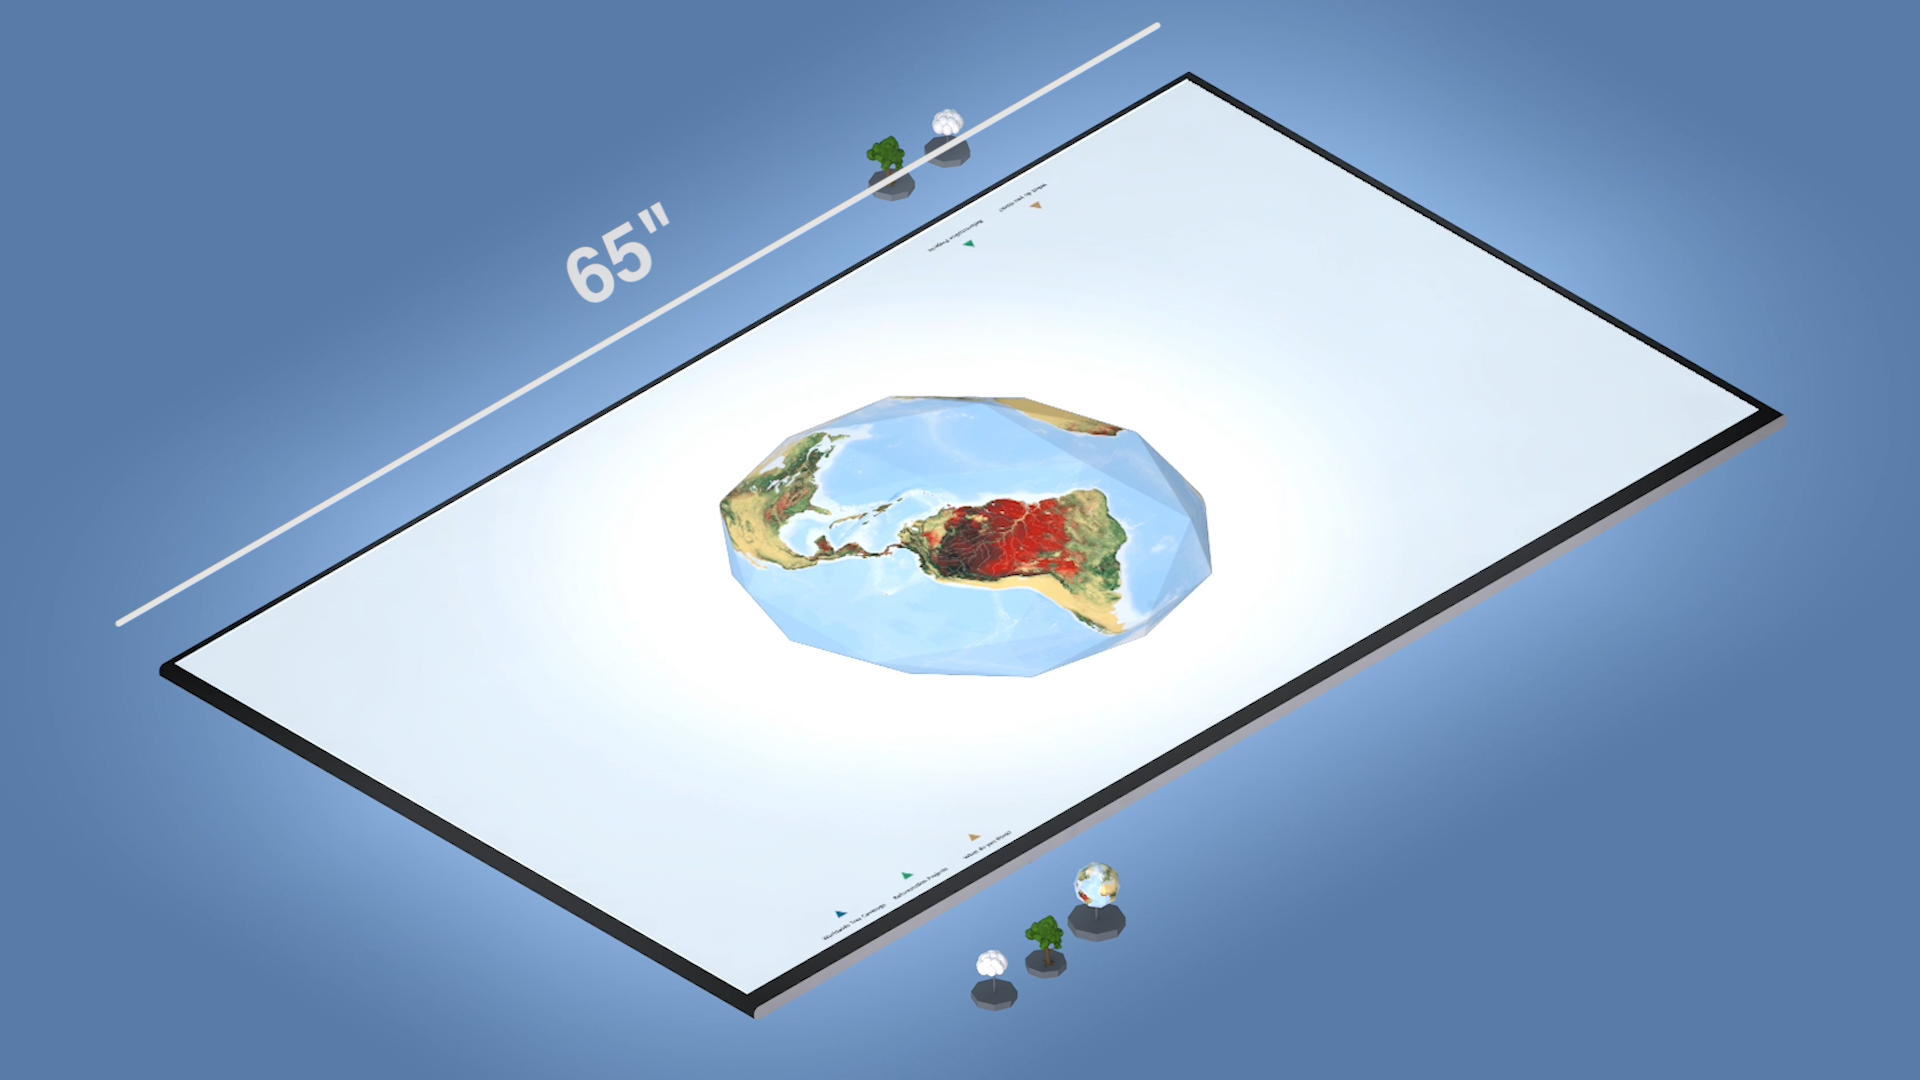
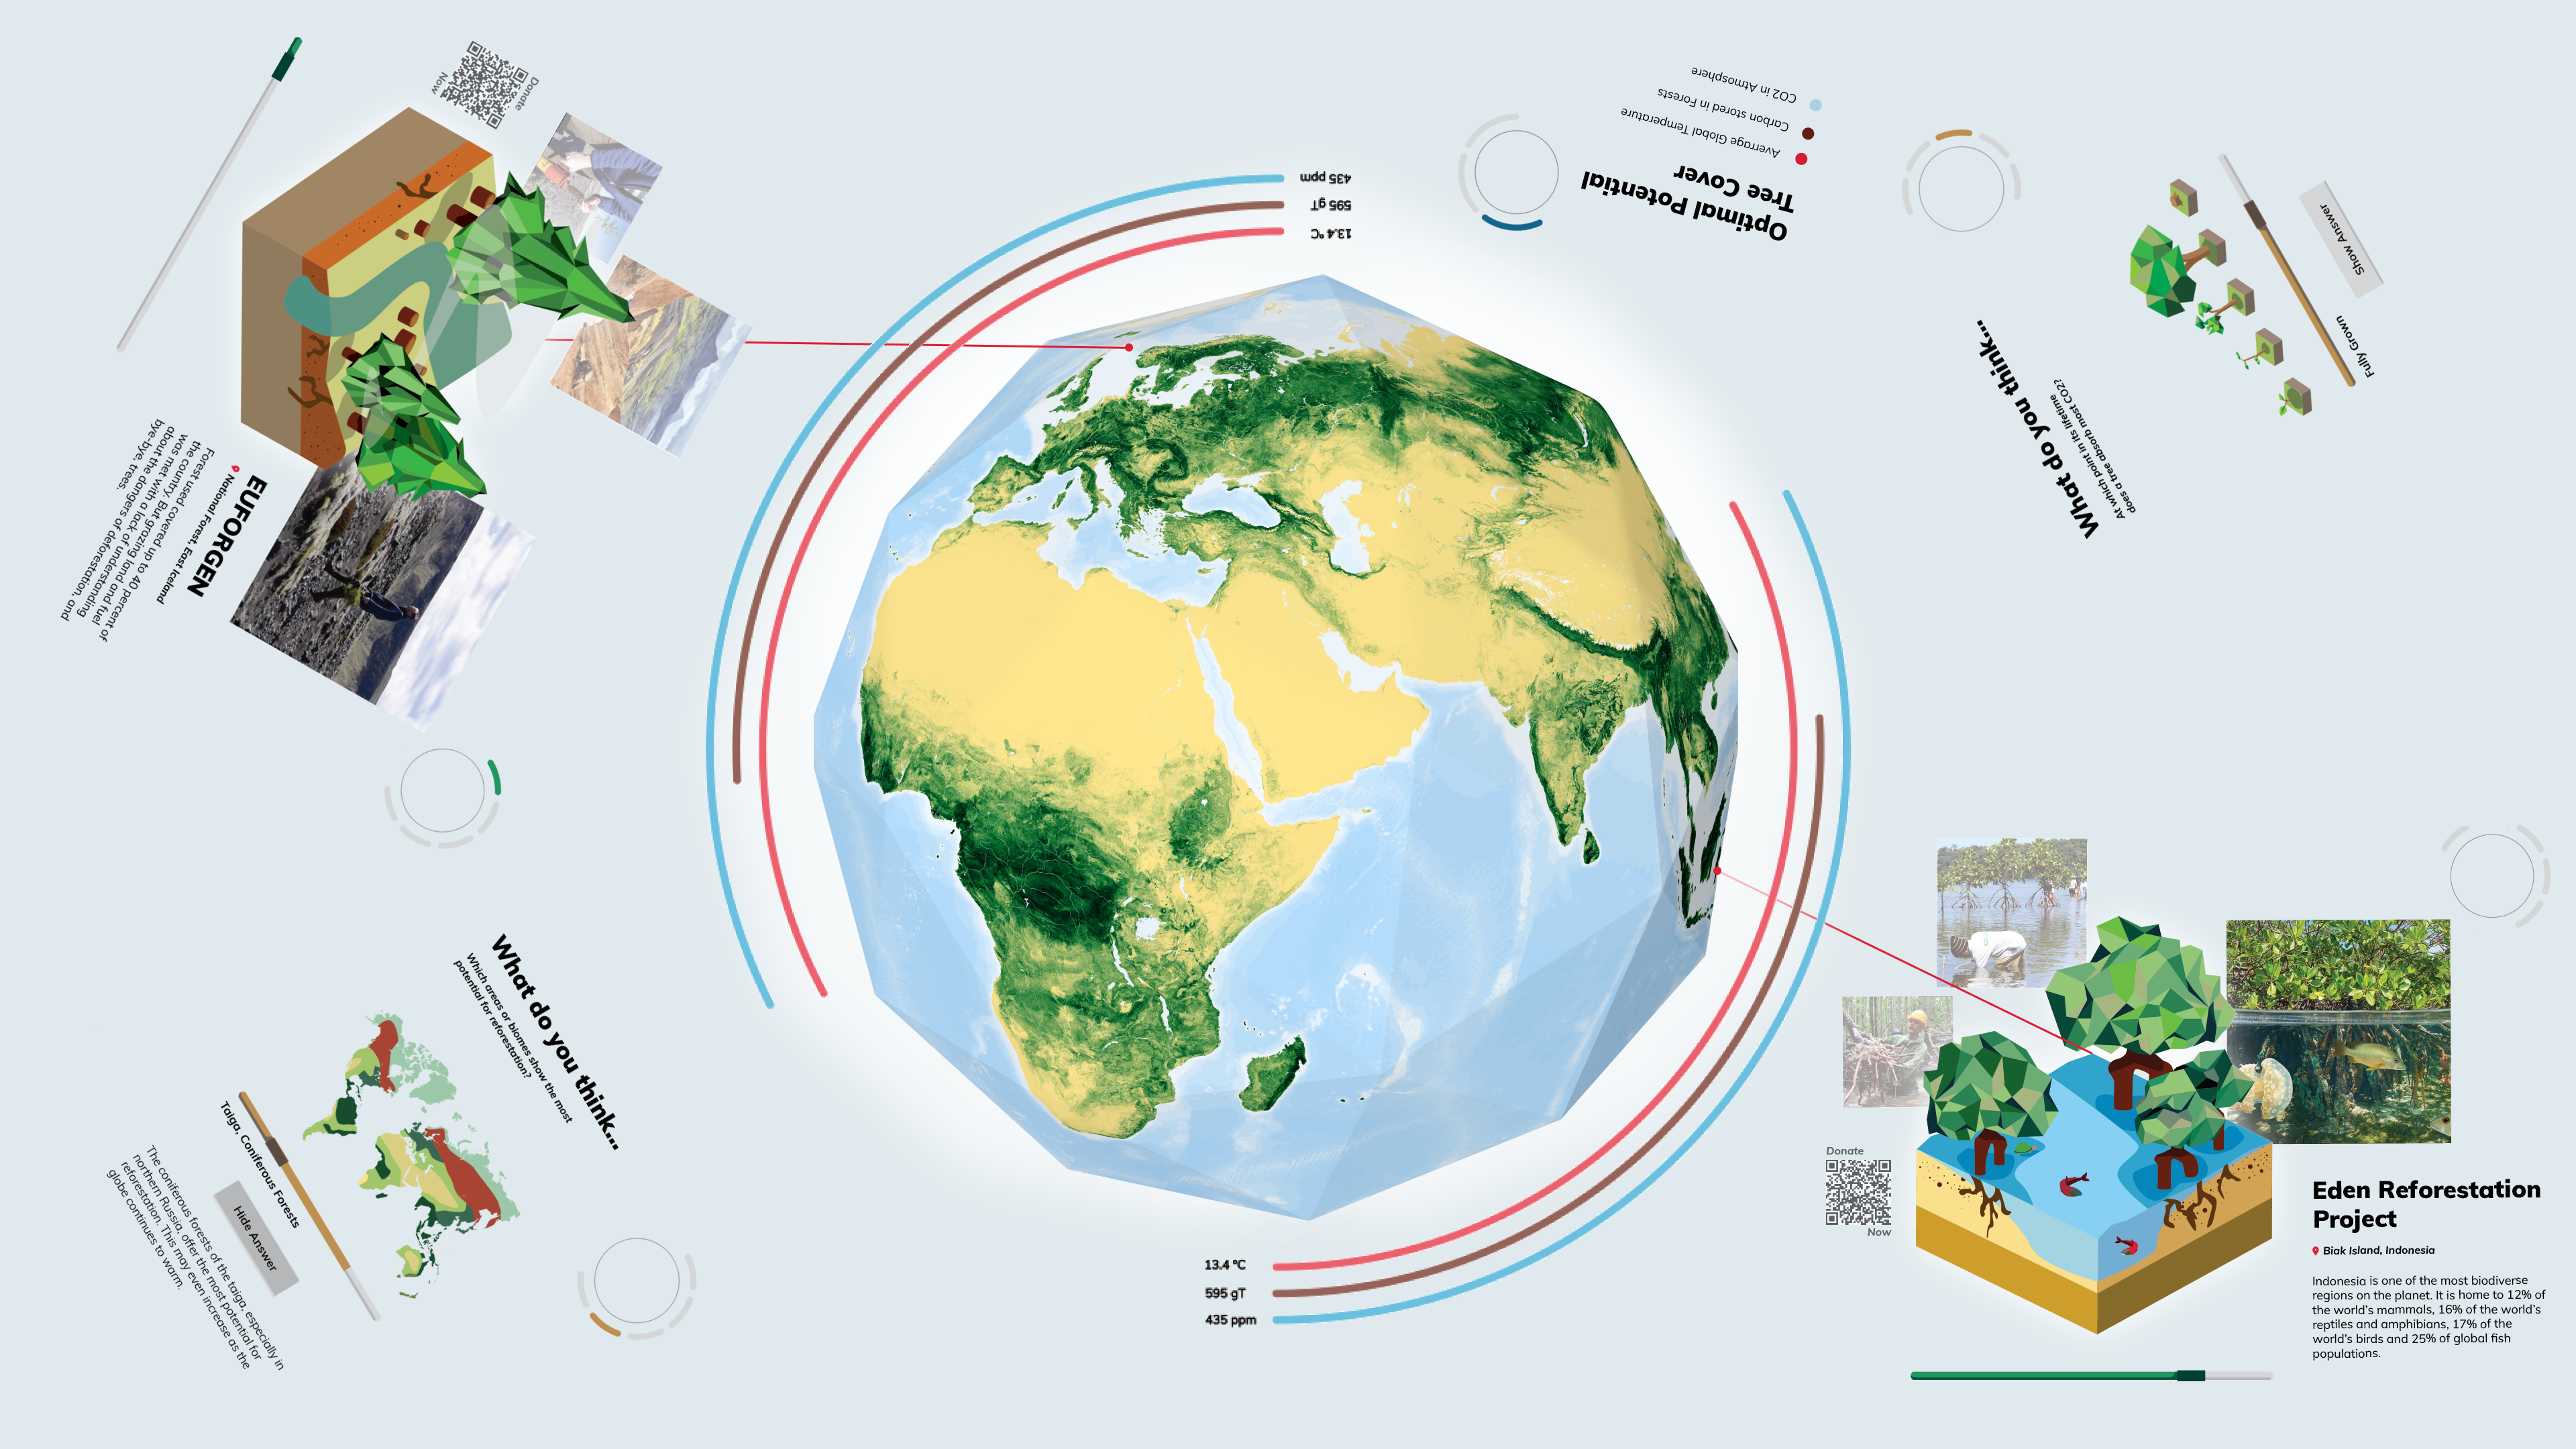
Based on the paper “The Global Tree Restoration Potential" by Tom Crowther in 2019 and other information provided by the lab, we designed a playful approach for people to receive more information about climate change and what positive impact one newly planted tree could have. The design is made for a 65’ screen which will be placed in an exhibition like a table, as well as IR tracking devices, with which visitors can play and interact seperately yet simulataneously.
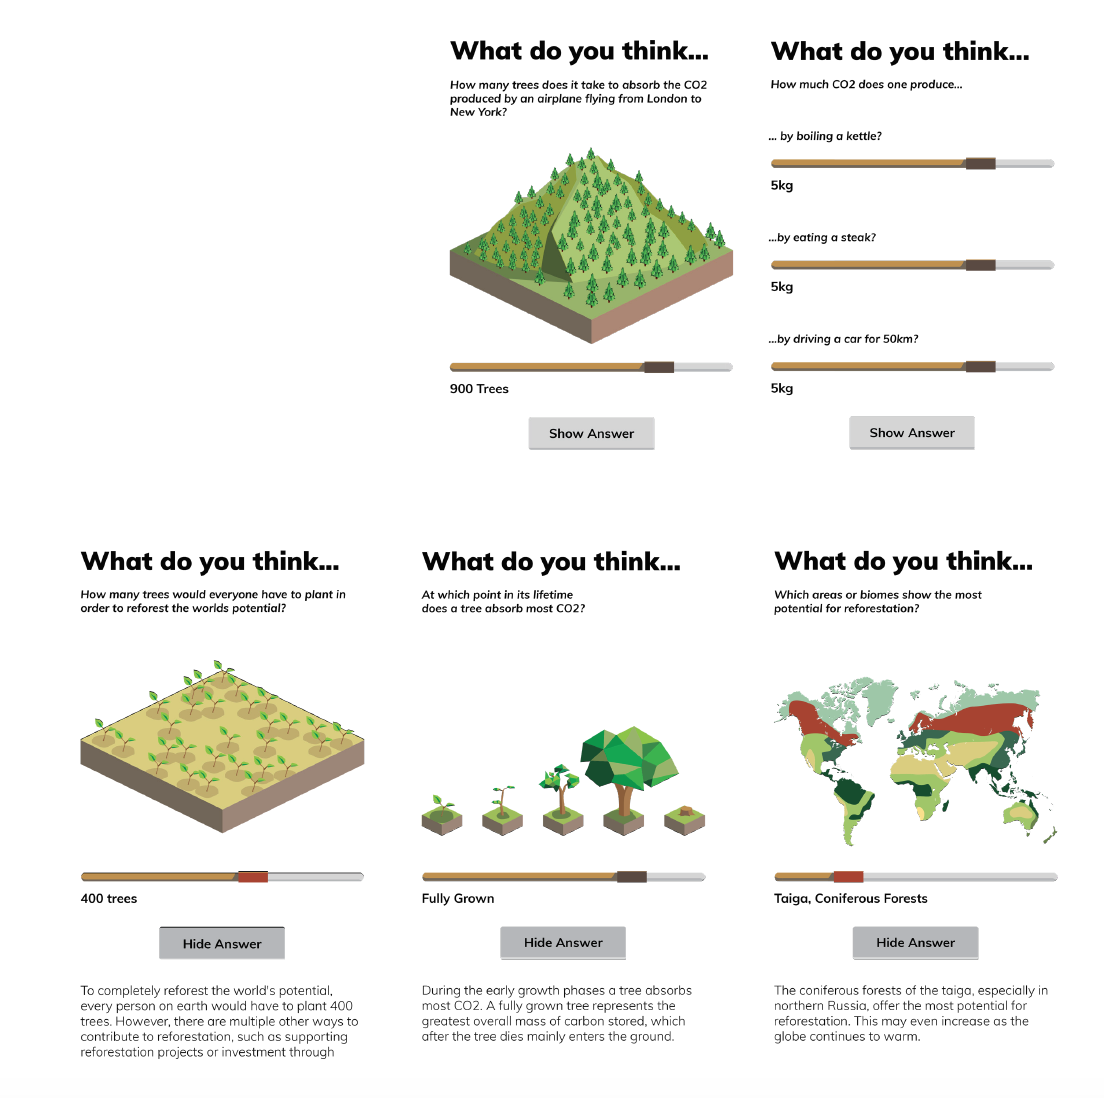
Through them and a lot of researching, we gained more information about the topic of climate change and trees. We wanted to focus on the following five key points.- Facts and Figures
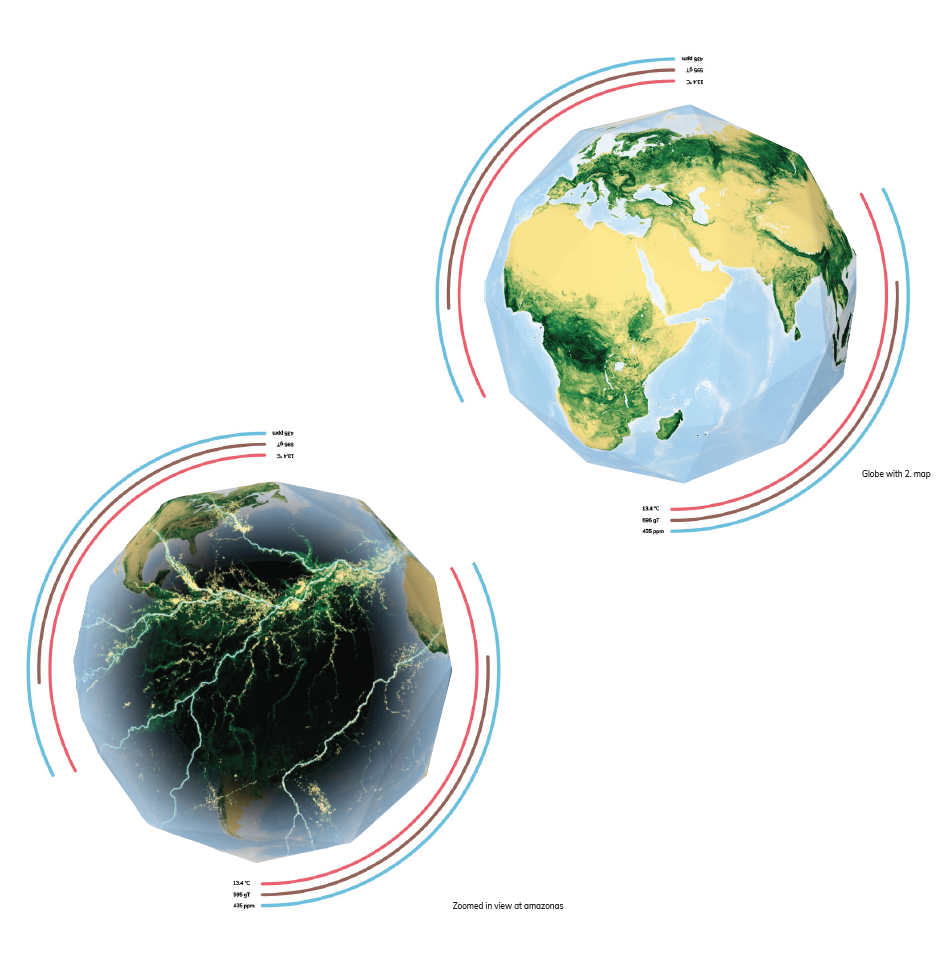
- Carbon Sequestration
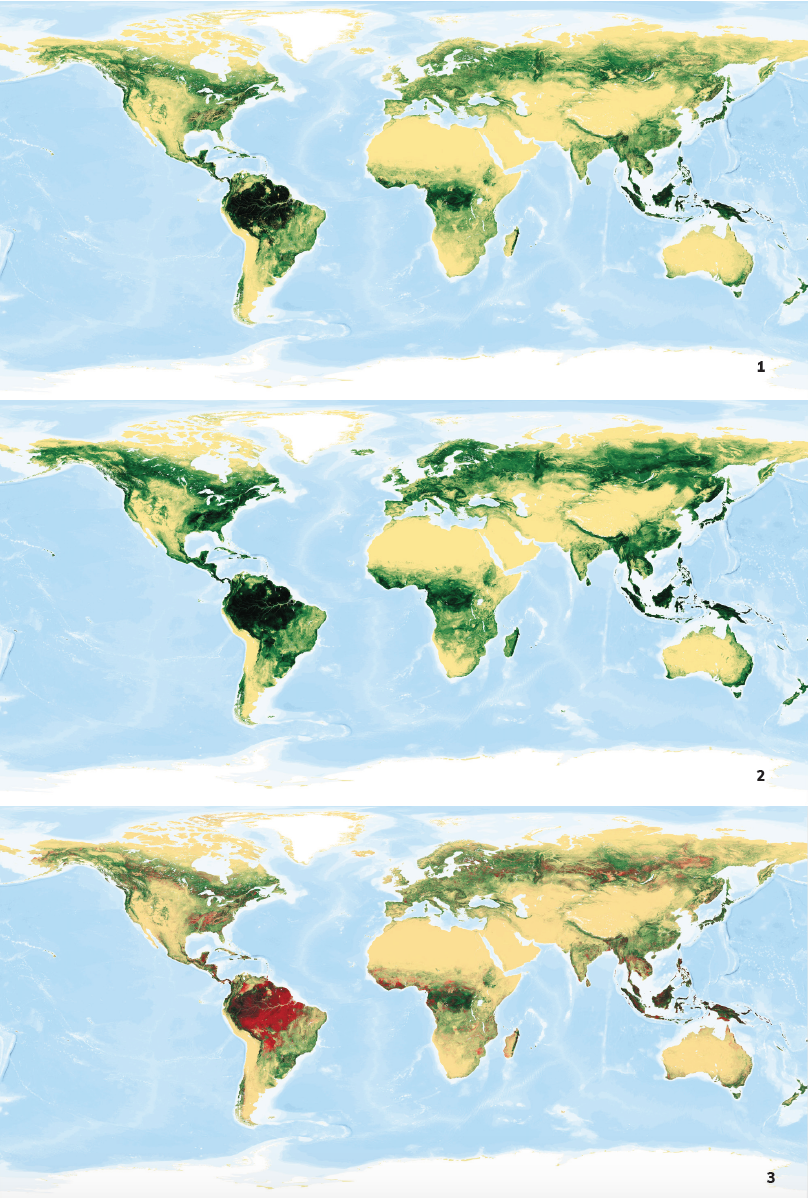
- Biomes
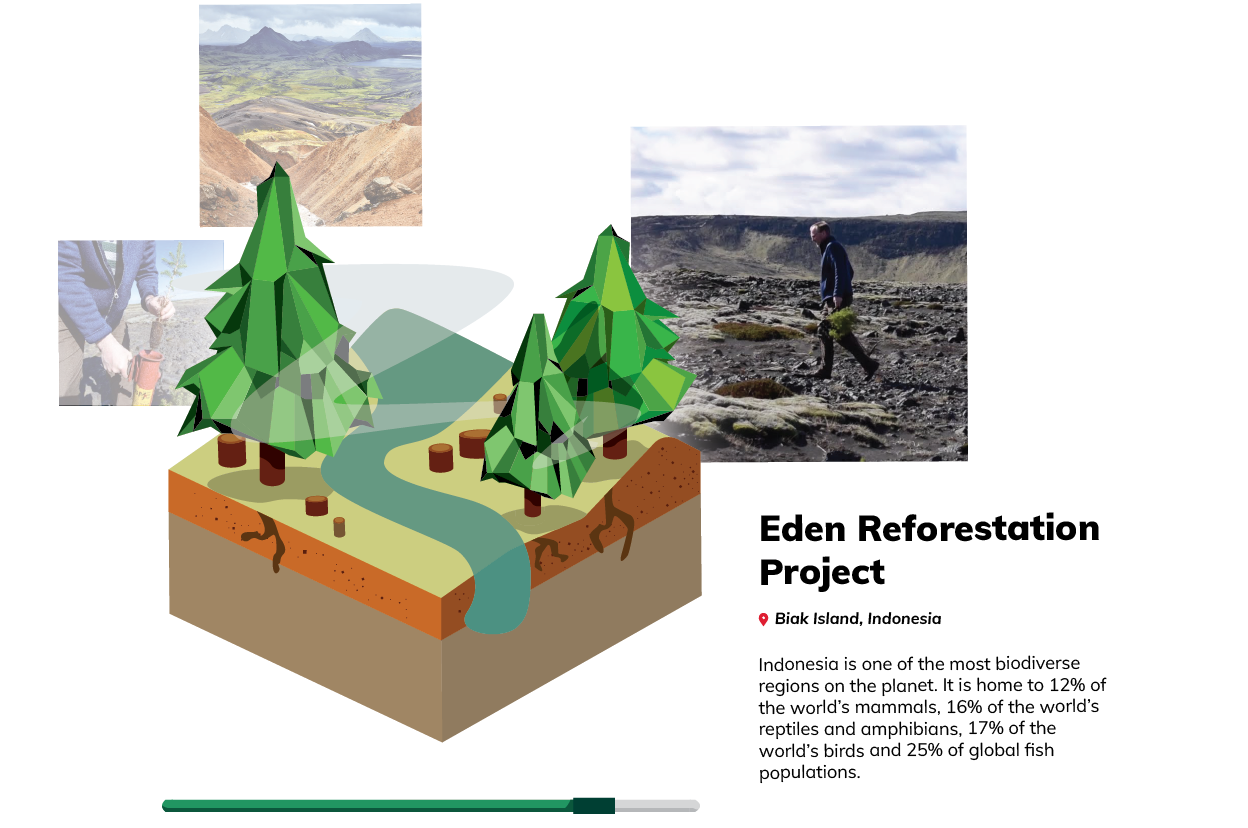
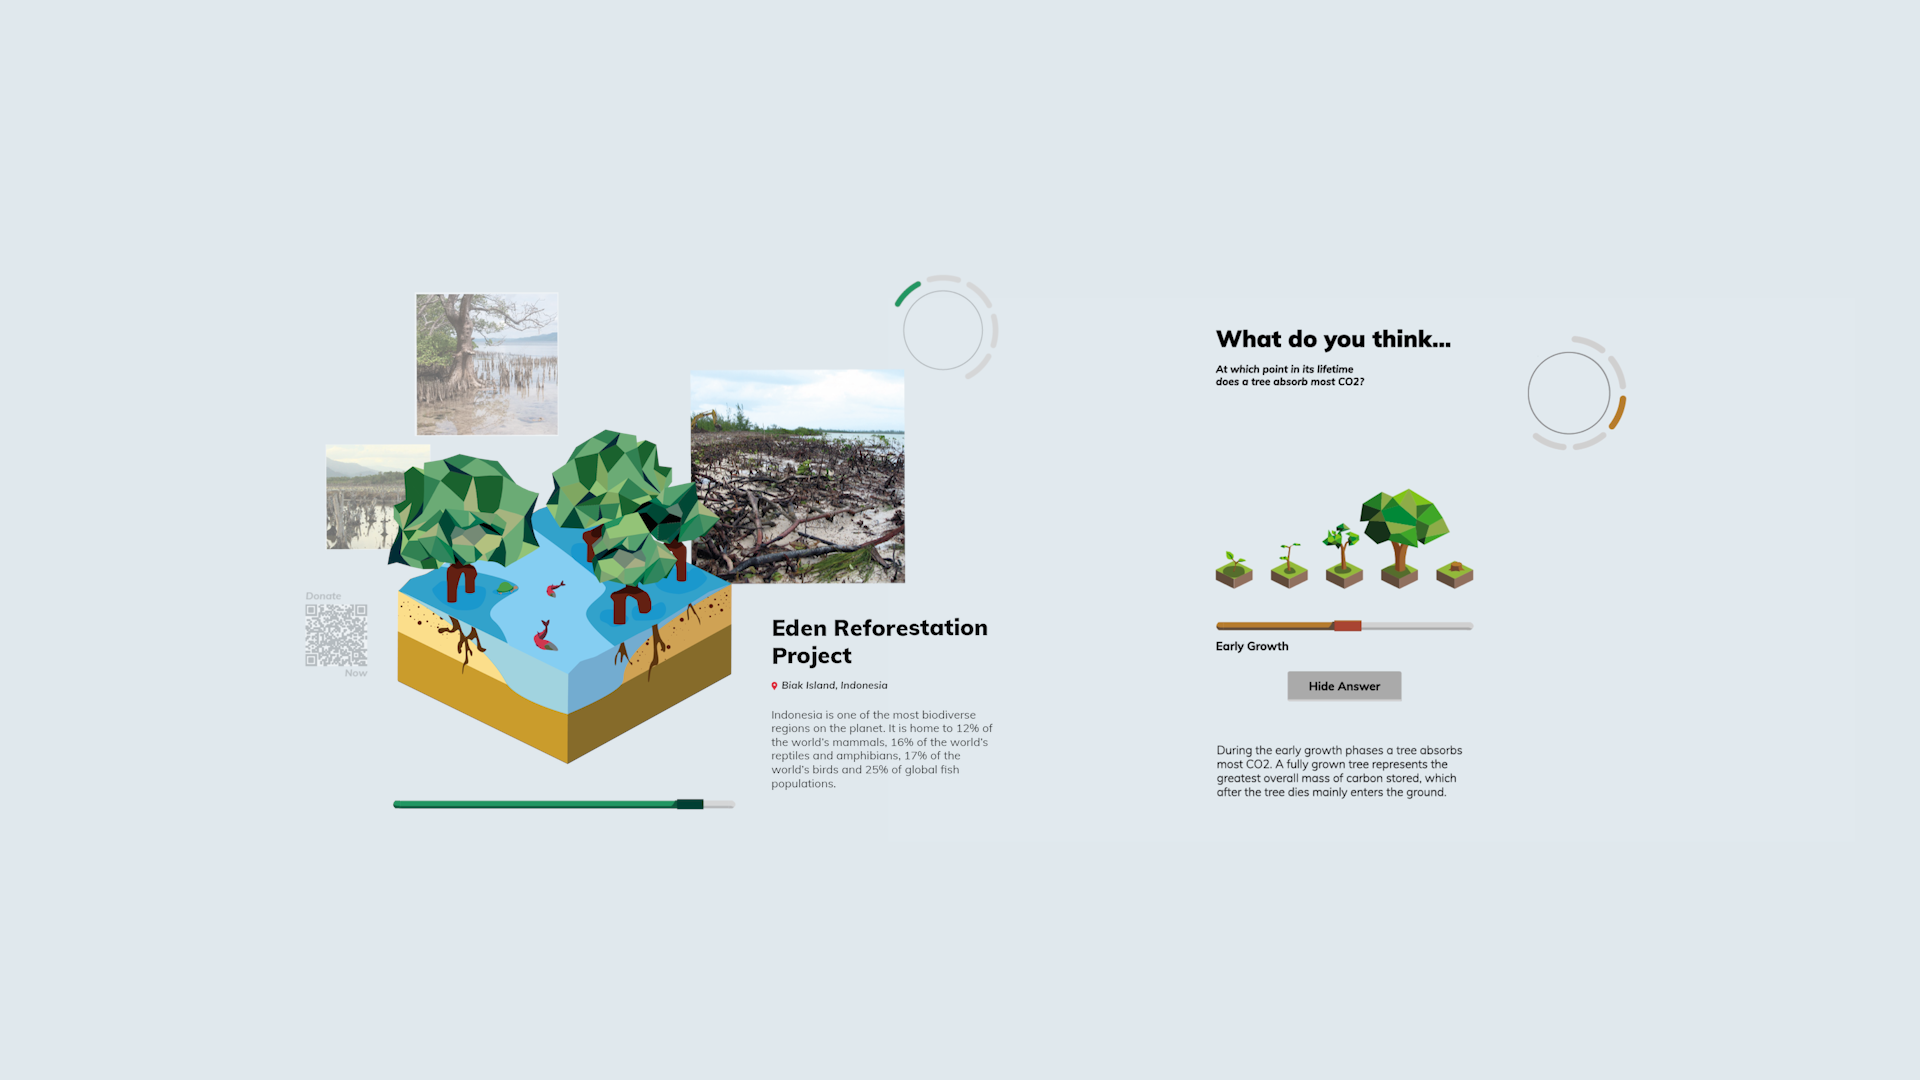
- Projects
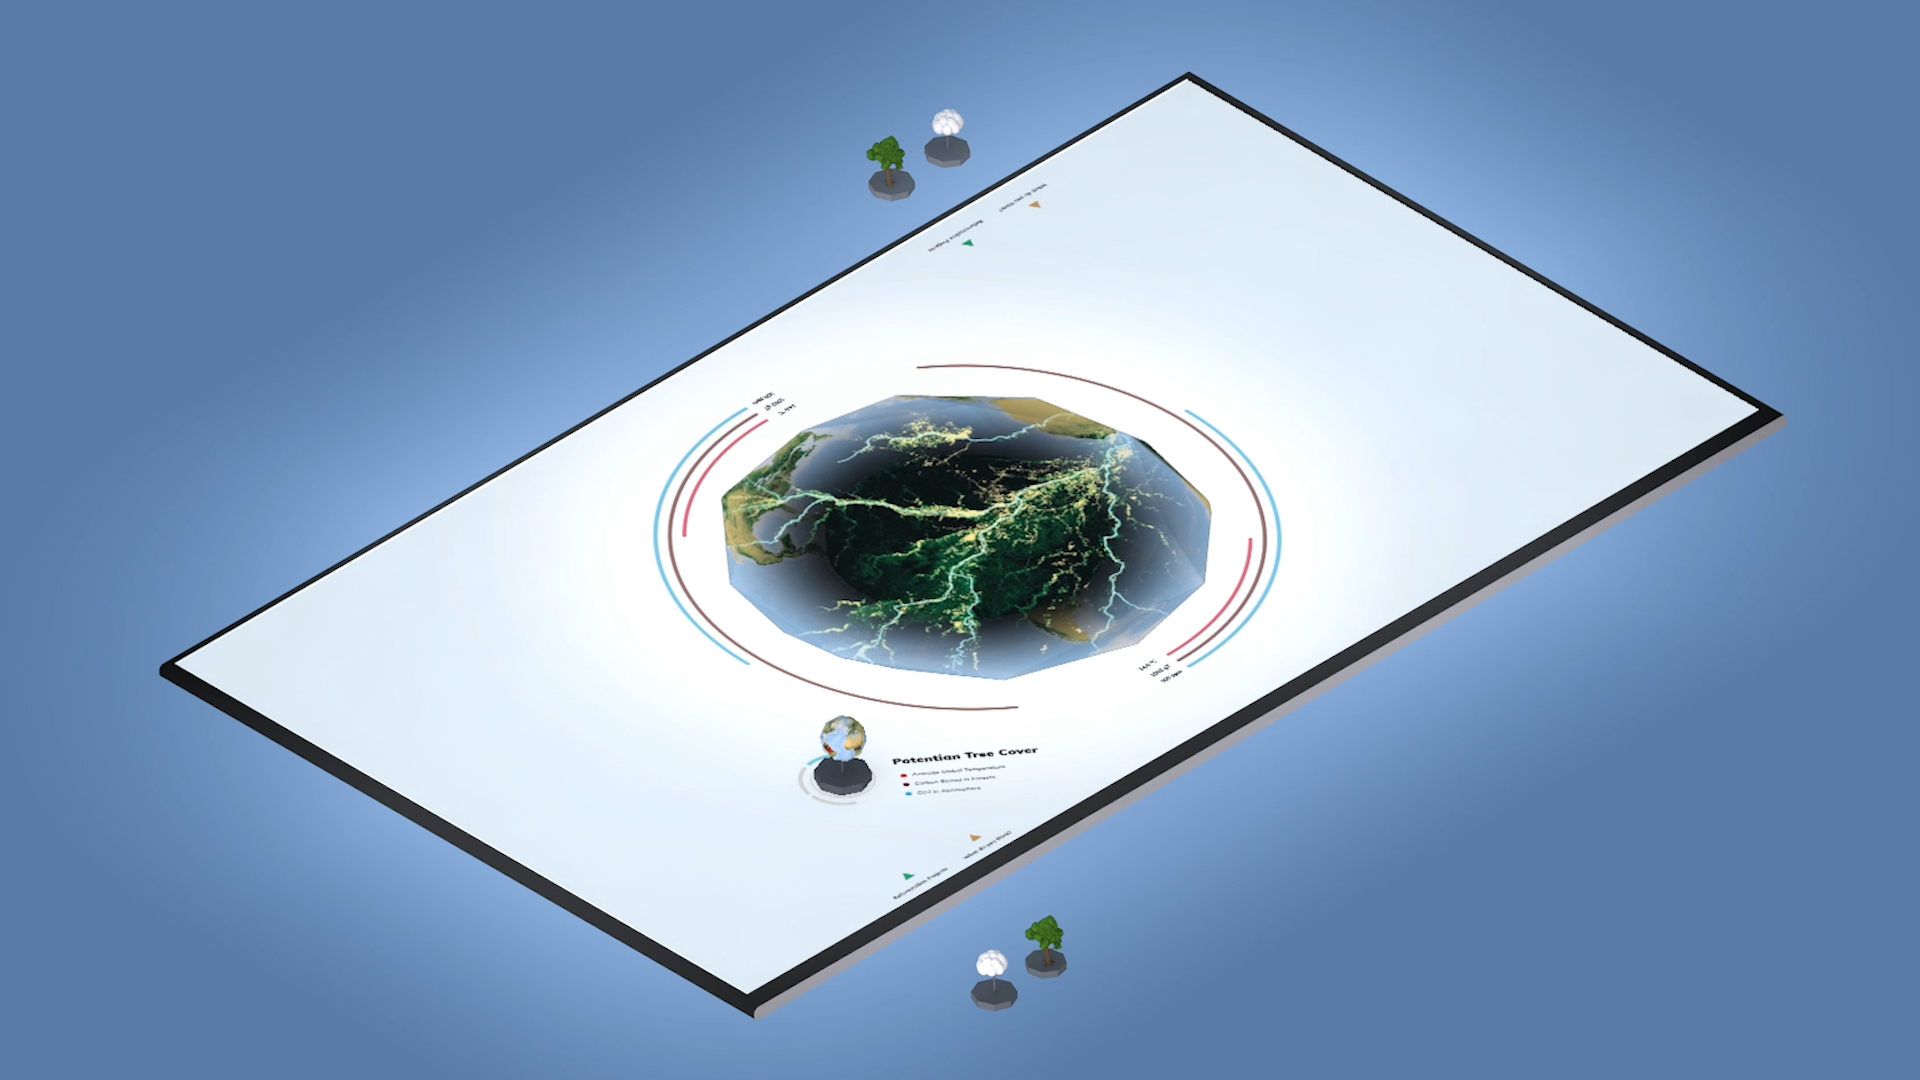
- Worldwide
Subsequently covering key messages encouraged by the Crowther Lab for us to cover which are:
- Forests play a huge role in regulating the climate
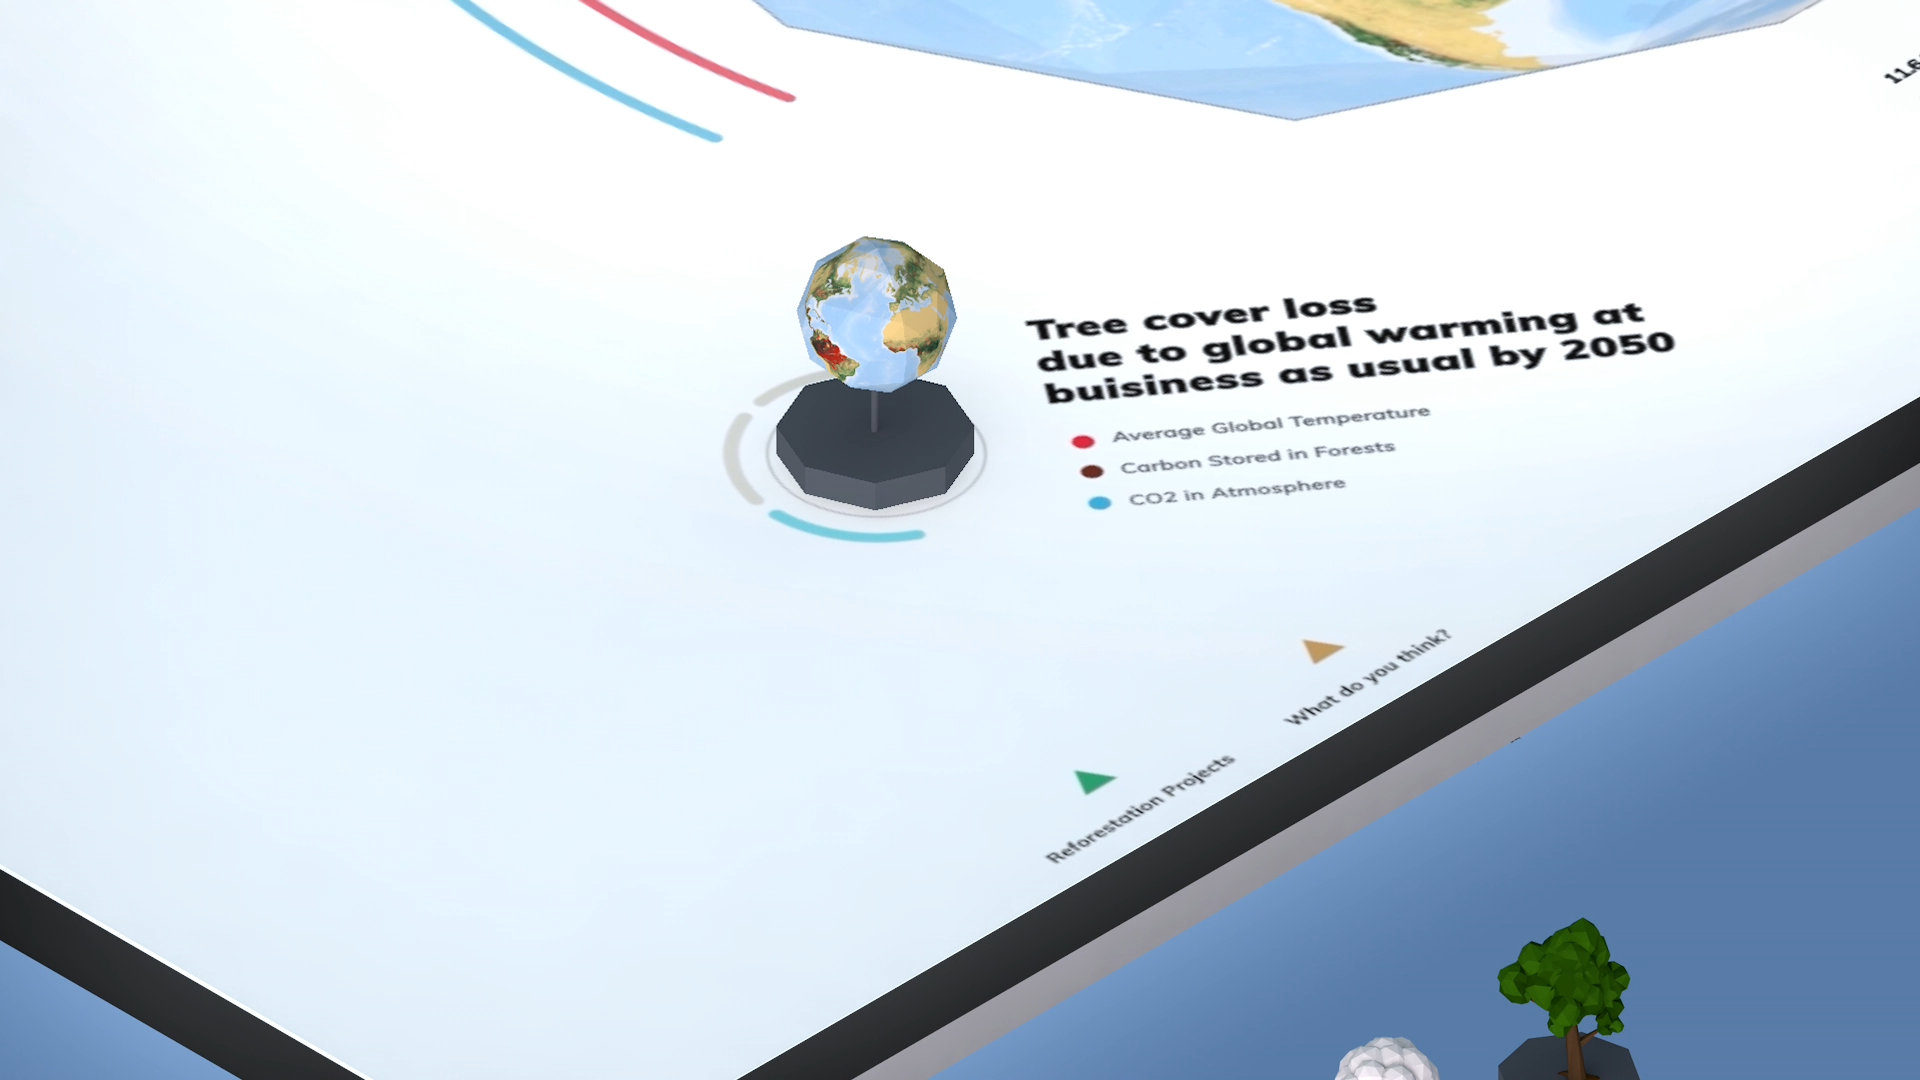
- The climate is changing - if we continue business as usual, the area of the world’s forests will shrink.
- Increasing forest cover will be a critical tool in combating climate change. (We estimate 0.9 billion hectares can drawdown 2/3’s of anthropogenic carbon in the atmosphere.)
- There are many other benefits to a forest - it’s not just about carbon drawdown but also air filtration, water cleanliness, wider biodiversity.
- There are many ways for citizens to get involved - restore, fund, invest responsibly.